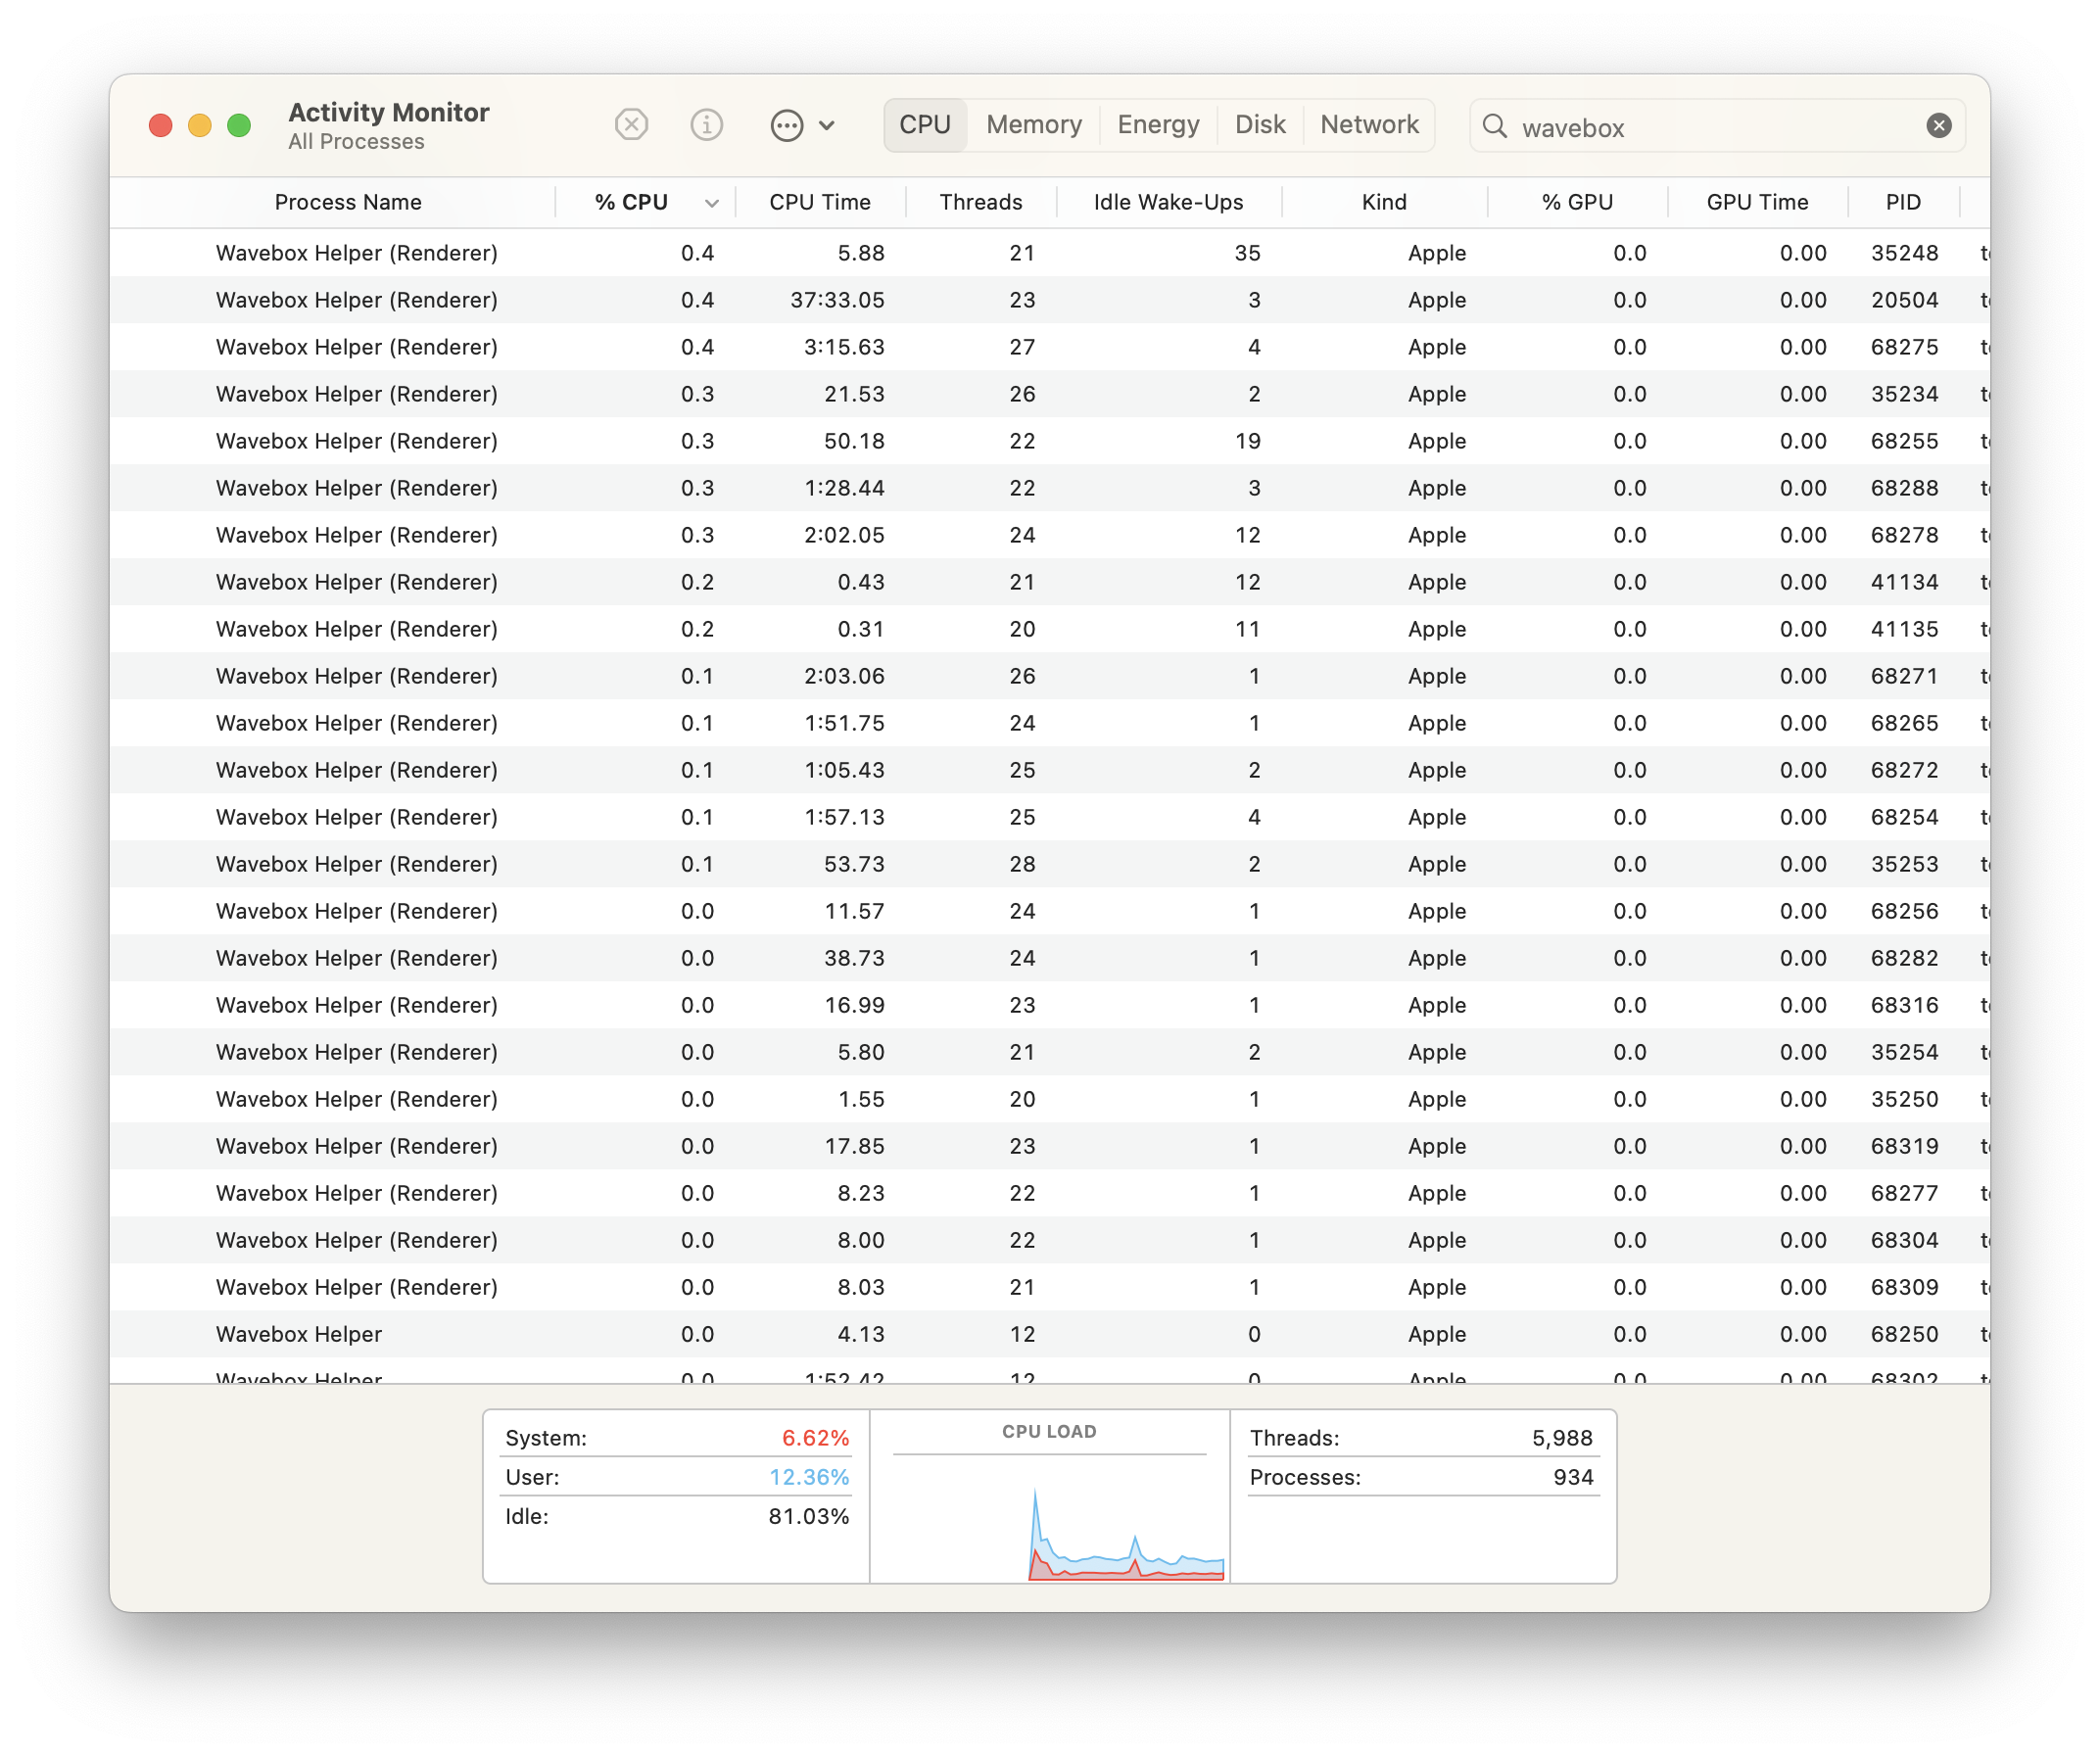
If you open the macOS activity monitor, or Windows task manager whilst Wavebox is running, you may see several Wavebox-related processes each with their own resource allocation.
Wavebox, like many other browsers, splits its runtime into multiple processes, meaning each tab runs as its own process. This has advantages like as providing hardened security between tabs and improved stability.
Why can I see multiple Wavebox processes in the task manager?
On macOS, the activity monitor shows several different names for Wavebox and these can be split into a few categories...
- Wavebox - this is the main Wavebox process that manages the user interface and the other processes
- Wavebox Helper (Renderer) - Each tab runs in its own process and these are listed as the render processes in the task manager
- Wavebox Helper (GPU) - This process provides dedicated graphics processing and hardware acceleration to Wavebox
- Wavebox Helper - These helper processes provide additional support for things like networking
On Windows, the task manager only shows multiple Wavebox processes and doesn't give any additional information.
Can I see what each process is doing?
Wavebox provides a built-in task manager that shows enhanced information about what each process is used for - this can be useful for debugging if one process has high resource usage, or if you're just curious.
To open the Wavebox task manager, click on the main app menu in the top-right of any window > more tools > task manager.
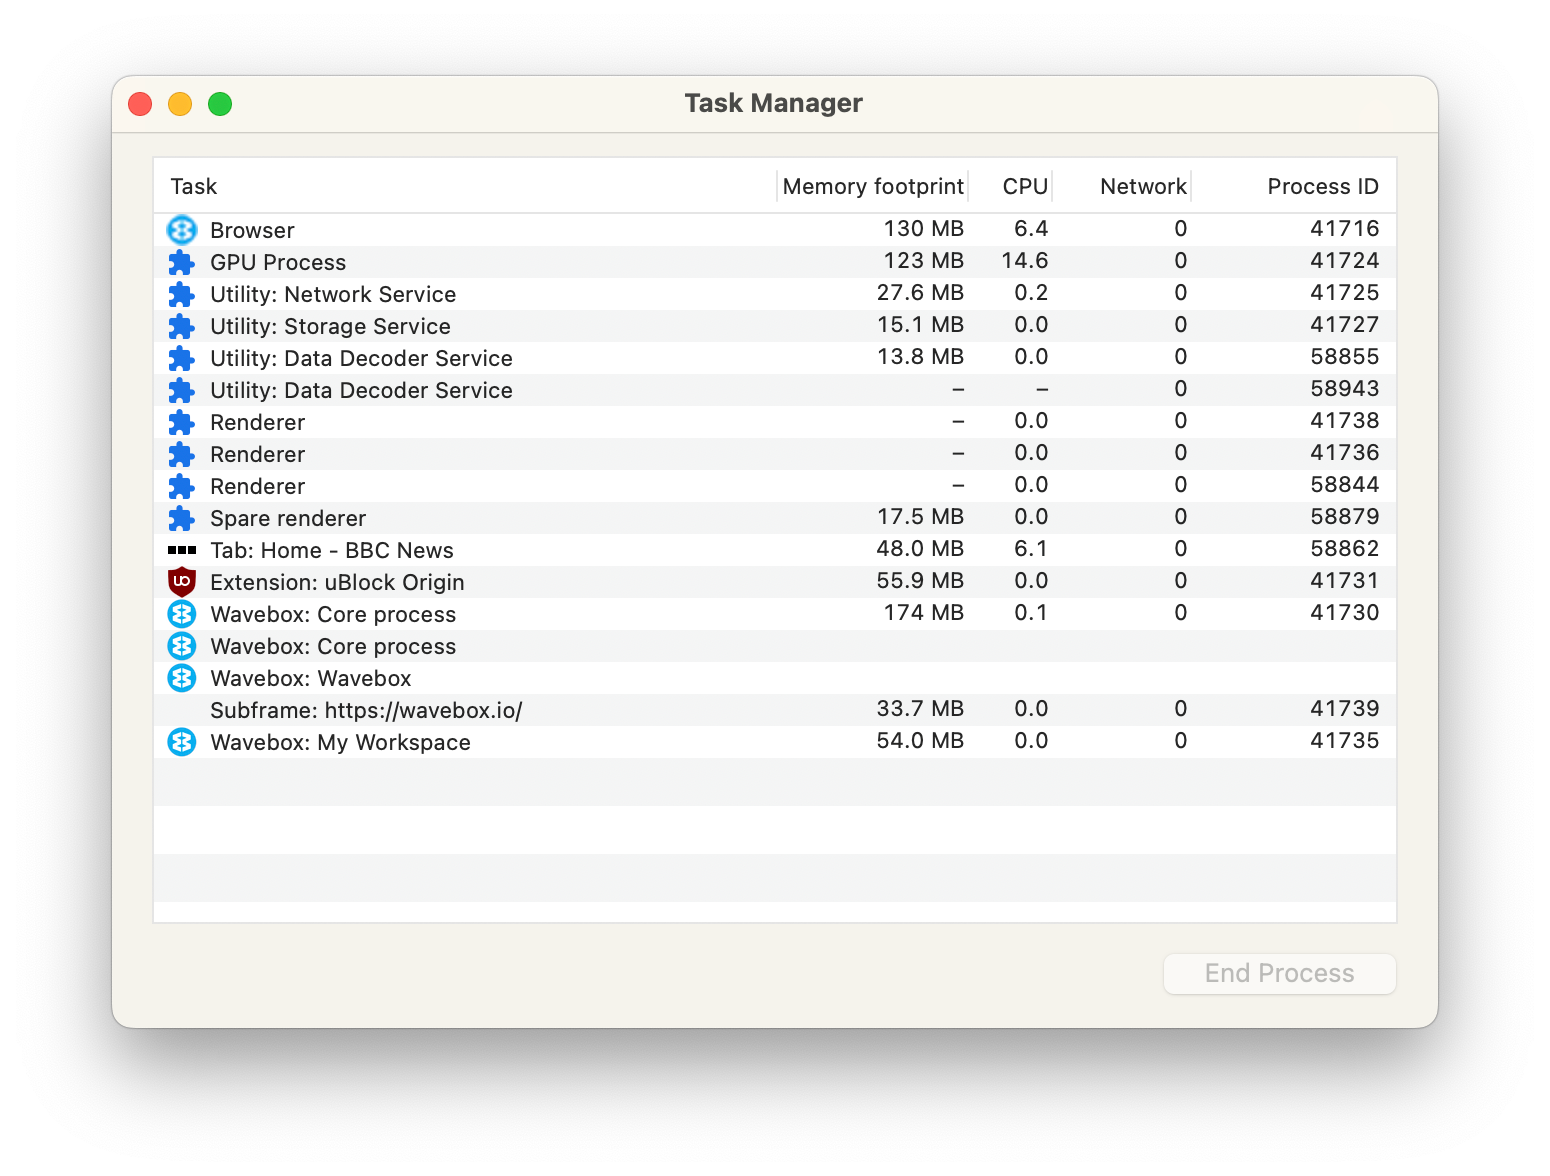
Here you can see a list of all the Wavebox processes. Some are specifically for tabs or extensions. Others provide general utility functionality to Wavebox such as network or audio services.
You can correlate the processes in the Wavebox task manager to those in the macOS activity monitor or Windows task manager. To do this you use the "Process ID" listed in Wavebox and match it to the "PID" in the macOS activity monitor or Windows task manager.
It's worth noting, that CPU usage normally increases whilst the Wavebox task manager is open as Wavebox has to continually monitor resource usage across all processes.
Can I view any in-depth information about Wavebox processes?
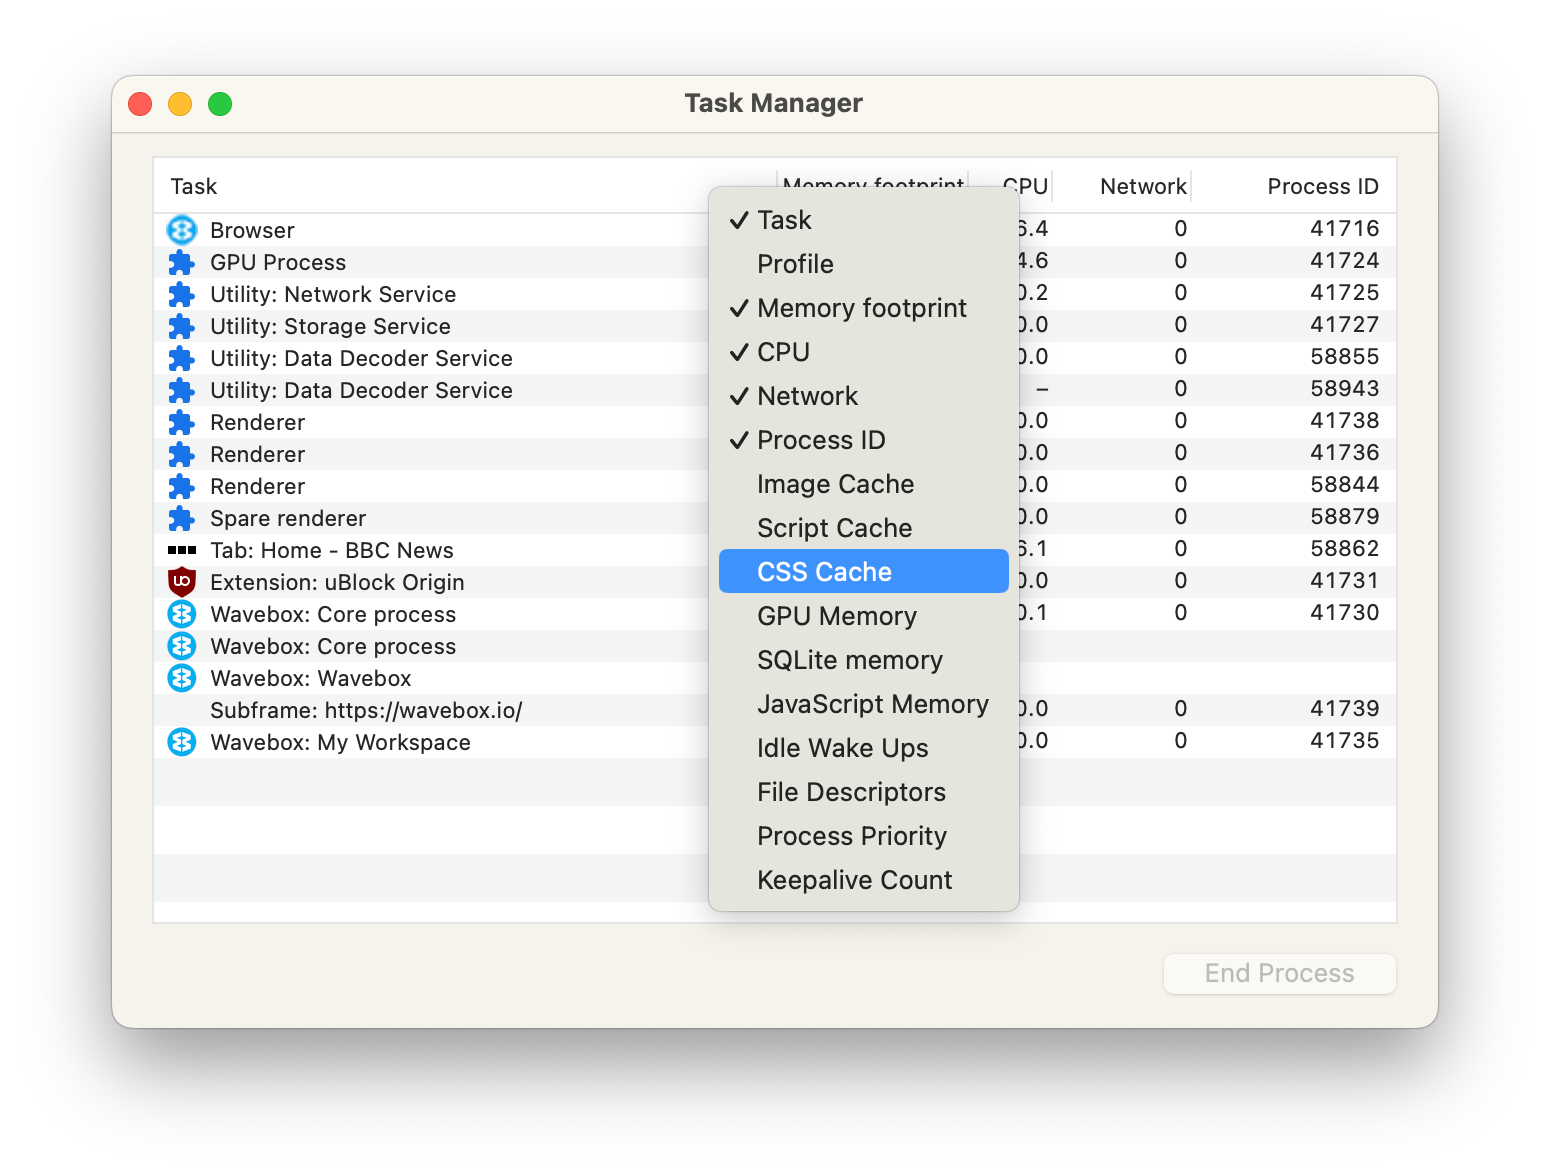
To see more information about Wavebox processes, open the Wavebox task manager and right-click in the table header. Here you can add additional columns that show more information about each running process.
Why does Wavebox have so many processes?
Wavebox creates multiple processes to speed up browsing, make your browser more resistant to crashes, and isolate tabs from each other, increasing security, performance and reliability.
Websites are complicated, and the more complex a website is, the more ways things can go wrong. If something does go wrong, it can result in a crash and if everything is running in a single process a single crash on one page can crash all of Wavebox. Isolating each tab in its own process means that a crash from one tab means just that tab will crash and not the whole browser.
The majority of computers these days have multiple processing cores, which means that they're great at multitasking. By splitting large portions of Wavebox into different processes, Wavebox can take advantage of this by splitting the workload more evenly across all processing cores on your machine. This results in much faster performance.
Running everything in separate processes also makes it easier to protect your computer against malicious code running on a website. Each process in Wavebox is sandboxed, which means they're mostly isolated from the rest of the system and only have a reduced set of privileges. If any malicious website tries to exploit Wavebox, the amount of damage it can do is limited to its own process and not the rest of Wavebox or your operating system.
One process has high CPU or memory usage, what can I do?
To make sites work, Wavebox runs JavaScript code that websites include within them. This code can provide things like enhanced interactivity and more, this sometimes means that a site uses a lot of CPU or memory, which can be detrimental to performance. If you see Wavebox running slowly or notice a process with high CPU usage, you can use the Wavebox task manager to investigate what is causing this.
To do this, open the Wavebox task manager, click on the main app menu in the top-right of any window > more tools > task manager.
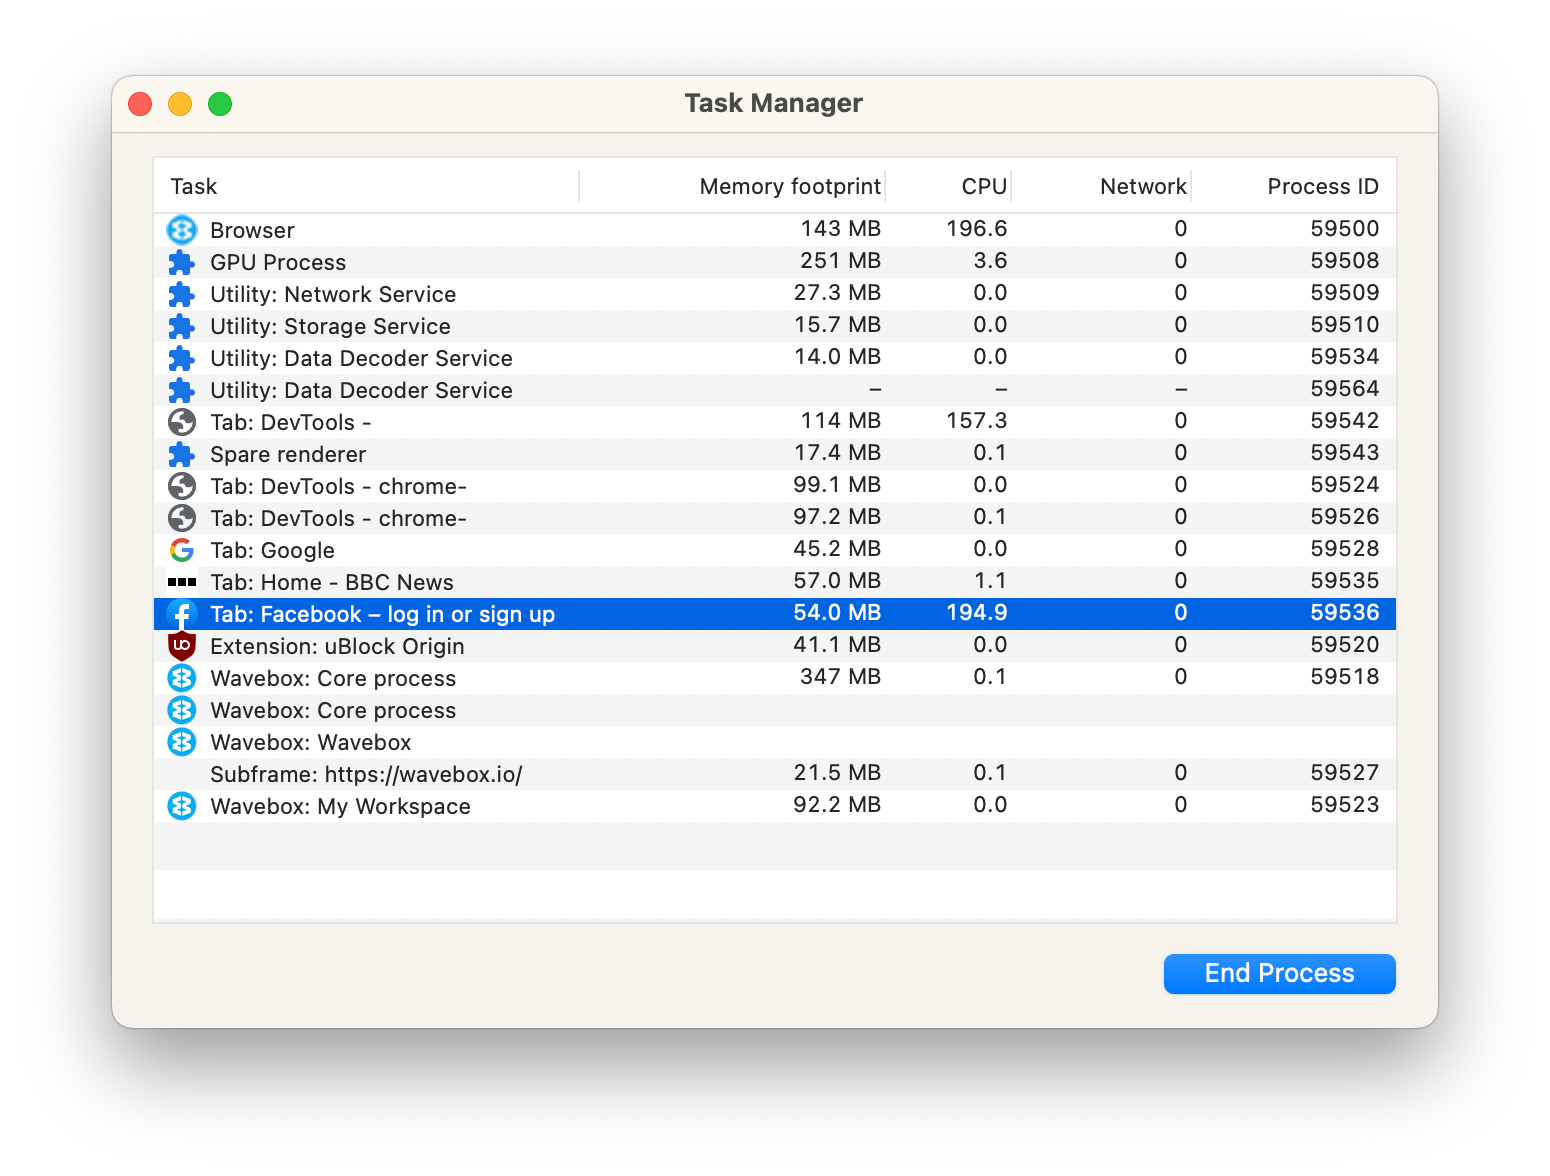
In the task manager, you might be able to spot a process with an unusually high memory footprint, or high CPU load. In the screenshot above, Facebook is using 194.9% CPU, which is unusual. You can end the process from the task manager, using the End process button.